
Ecommerce Core Web Vitals: what actually moves the numbers
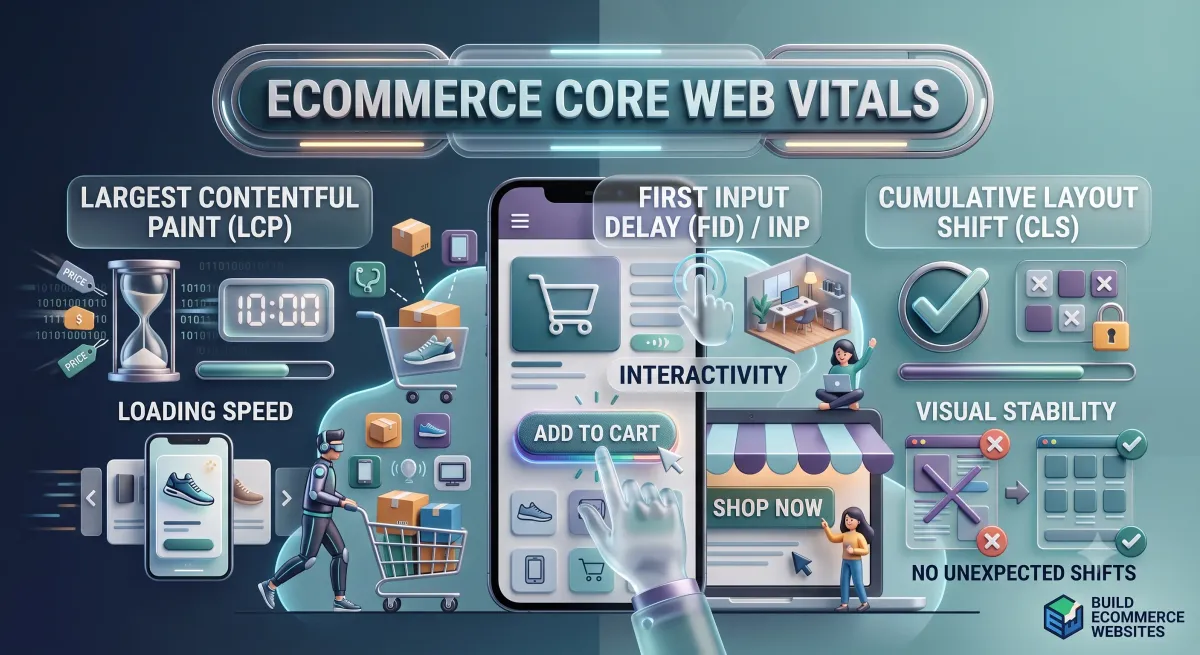
On an ecommerce store, Largest Contentful Paint is usually decided by the first image, Interaction to Next Paint by third-party scripts, and Cumulative Layout Shift by content that arrives after the page has drawn. Field data from real visitors is the only measurement that counts. Lab scores are a debugging tool, not a target.
Core Web Vitals arrive in most stores as a red panel in Search Console and leave as a quote for a rebuild. Between those two events there is usually a week of work that would have fixed it, and the reason it does not happen is that nobody separates the three metrics from each other.
The three metrics, and what each one means on a store
Three numbers, each measuring a different kind of failure. The definitions are on web.dev; what follows is what each tends to mean when the site selling something is the one being measured.
| Metric | Measures | Usual ecommerce culprit | Threshold |
|---|---|---|---|
| LCP | How long until the main content appears | The first image, unoptimised or discovered late | 2.5s |
| INP | How long the page takes to respond to a tap | Third-party JavaScript from apps and tags | 200ms |
| CLS | How much the layout jumps after drawing | Banners, badges and images without reserved space | 0.1 |
Treating them as one score is the mistake that produces rebuild quotes. They have different causes, different fixes and different costs, and a store usually fails one of them rather than all three.
Field data is the only measurement that counts
Two kinds of measurement exist and only one of them is the thing being assessed.
Lab data is a single run on hardware you chose, on a connection you have, with your cache state. Lighthouse produces it. Its value is diagnostic: it tells you what is slow and why.
Field data is what real visitors actually experienced, gathered from Chrome and reported through the Chrome UX Report and Search Console. Its value is judicial: it decides whether you have a problem.
The two will disagree, sometimes dramatically, and the field data is the one that is right. A store whose lab score is 95 on a developer’s laptop and whose field LCP is four seconds has a four-second problem, because visitors are on mid-range phones on mobile networks, and a good number of them are on the other side of the world from the server.
Test the templates that carry traffic. Field data is grouped by URL pattern precisely because a homepage and a product page are different pages, and the homepage — the one everybody tests — is usually the fastest and least representative page in the store.
LCP: it is the image, and it is the first one
On stores, LCP is an image problem almost every time, and there are only three ways it goes wrong.
The image is too large. A 2400px hero delivered to a 390px phone is the most common single fault we find. Responsive sources and a modern format fix it, usually cutting the transferred bytes by most of their weight.
The image is discovered late. If the browser only learns about the hero after parsing CSS or running JavaScript, the download starts late no matter how small the file is. The fix is to make it discoverable in the initial HTML and, where warranted, to preload it.
The image is lazy-loaded when it should not be. Lazy loading is correct for everything below the fold and actively harmful for the LCP element, because it defers exactly the thing being measured. This is a one-attribute fix that we find on a surprising share of audits.
There is a fourth case, less common and more expensive: LCP is text, and the text is waiting for a web font. Font display strategy fixes that without a redesign.
INP: the apps are doing it
Interaction to Next Paint replaced First Input Delay because it measures every interaction rather than the first one, and it exposed something that stores had been getting away with: INP is dominated by third-party JavaScript.
On a typical store that means the app stack. A review widget, a chat launcher, two analytics tags, a personalisation script and a consent banner each want main-thread time, and a tap on the variant selector waits behind whichever one is busy.
The fixes, in order of how much they usually return:
- Remove apps nobody uses. This is the largest and cheapest win available on most stores, and it is the one that gets deferred because removing things feels risky.
- Load what remains after interaction becomes possible rather than during page load.
- Move tags behind a consent gate that genuinely defers them until consent, which many implementations do not.
- Break up your own long tasks last, because on most stores your code is not the problem.
We have measured stores where removing three unused apps moved INP more than a fortnight of code optimisation would have.
CLS: reserve the space
Cumulative Layout Shift is the cheapest of the three to fix and the most irritating to a customer, because it is what makes a tap land on the wrong thing.
Four causes account for nearly all of it: images without width and height attributes, banners injected above existing content, badges and star ratings arriving after the card has drawn, and web fonts swapping to a face with different metrics.
Every one is fixed by reserving space before the content arrives. Dimensions on images, a fixed height on the announcement bar, a placeholder the size of the review widget, and font metrics that match the fallback.
What to do first, and what it costs
Ordered by return against effort, which is not the order a rebuild quote suggests.
| Order | Work | Typical effort | Moves |
|---|---|---|---|
| 1 | Audit and remove unused apps | A day | INP, LCP |
| 2 | Fix image sizing and formats | A day or two | LCP |
| 3 | Add dimensions and reserve space | Half a day | CLS |
| 4 | Correct lazy loading on the LCP element | An hour | LCP |
| 5 | Defer remaining third-party scripts | A day | INP |
| 6 | Theme or template work | Weeks | All three |
Rows one to five are configuration and housekeeping on most platforms. Row six is a project. Quoting row six before trying rows one to five is how performance work gets a reputation for being expensive.
The honest case for doing this
Core Web Vitals are a real ranking signal and a modest one. A slow page about the right thing still beats a fast page about the wrong thing, and any agency implying otherwise is selling the wrong benefit.
The better argument is the customer. A visitor who taps a variant and sees nothing happen for half a second does not file a bug; they leave, and they were already interested enough to tap. That loss does not appear in any report — which is precisely why it goes unfixed for years.
Our stated position, offered as opinion: fix these because the store is unpleasant to use, and take the ranking effect as a bonus. Stores that chase the number tend to optimise the homepage, which is the page the least revenue depends on.
Measuring your own store this week
Three steps, no tooling to buy.
Read the field data. Search Console’s Core Web Vitals report, grouped by URL pattern. Note which template fails and which metric.
Reproduce it in the lab. Run Lighthouse on that template with mobile throttling — not on your desktop connection, which describes nobody.
Fix one thing and wait. Field data is a 28-day rolling window, so the report will not move tomorrow. Changing five things at once and watching one number is how teams end up unable to say what worked.